Histogram Basics
- Historams are constructed by binning the data and counting the number of observations in each bin. Common choices for the vertical scale are
- bin counts, or frequencies
- counts per unit, or densities
- The objective is usually to visualize the shape of the distribution.
A HISTOGRAM FOR COUNTING DATA
- The frequency of any particular x value is the number of times that value occurs in the data set.
- The relative frequency of a value is the fraction or proportion of times the value occurs.
- A frequency distribution is a tabulation of the frequencies and/or relative frequencies.
Drawing histogram for counting data
- First, determine the frequency and relative frequency of each x value.
- Then mark possible x values on a horizontal scale.
- Above each value, draw a rectangle whose height is the relative frequency (or alternatively, the frequency) of that value.

(Nguồn: https://think.design/services/data-visualization-data-design/histogram/)
This construction ensures that the area of each rectangle is proportional to the relative frequency of the value.
A HISTOGRAM FOR MEASUREMENT DATA: EQUAL CLASS WIDTHS
- Constructing a histogram for measurement data (observations on a “measurement variable”) entails subdividing the measurement axis into a suitable number of class intervals or classes, such that each observation is contained in exactly one class.
- One potential difficulty is that occasionally an observation falls on a class boundary and therefore does not lie in exactly one interval.
- We can use the convention that any observation falling on a class boundary will be included in the class to the right of the observation.
Drawing histogram for measurement data
- Determine the frequency and relative frequency for each class.
- Mark the class boundaries on a horizontal measurement axis.
- Above each class interval, draw a rectangle whose height is the corresponding relative frequency (or frequency).
Note:
- There are no hard-and-fast rules concerning either the number of classes or the choice of classes themselves
- A reasonable rule of thumb is that the number of classes can be approximate the square root of the number of observations.
- Equal-width classes may not be a sensible choice if a data set “stretches out” to one side or the other.
- Using a small number of equal-width classes results in almost all observations falling in just one or two of the classes.
- If a large number of equal-width classes are used, many classes will have zero frequency.
- A sound choice is to use a few wider intervals near extreme observations and narrower intervals in the region of high concentration.
A HISTOGRAM FOR MEASUREMENT DATA: UNEQUAL CLASS WIDTHS
- After determining frequencies and relative frequencies, calculate the height of each rectangle using the formula
rectangle height = relative frequency of the class : class width
- The resulting rectangle heights are usually called densities, and the vertical scale is the density scale. This prescription will also work when class widths are equal.
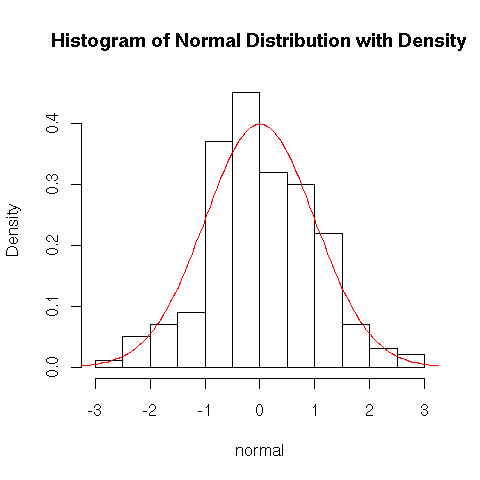
(Nguồn: https://datamining.togaware.com/survivor/Basic_Histogram0.html)
- When class widths are unequal, not using a density scale will give a picture with distorted areas.
- A density histogram does have one interesting property: the area of each rectangle is the relative frequency of the corresponding class. Because the sum of relative frequencies must be 1.0 (except for roundoff), the total area of all rectangles in a density histogram is l.
- It is always possible to draw a histogram so that the area equals the relative frequency (this is true also for a histogram of counting data)—just use the density scale.
Histogram Shapes
- A unimodal histogram is one that rises to a single peak and then declines.
- A bimodal histogram has two different peaks.
- A histogram with more than two peaks is said to be multimodal
- A histogram is symmetric if the left half is a mirror image of the right half.
- A unimodal histogram is positively skewed if the right or upper tail is stretched out compared with the left or lower tail and negatively skewed if the stretching is to the left.
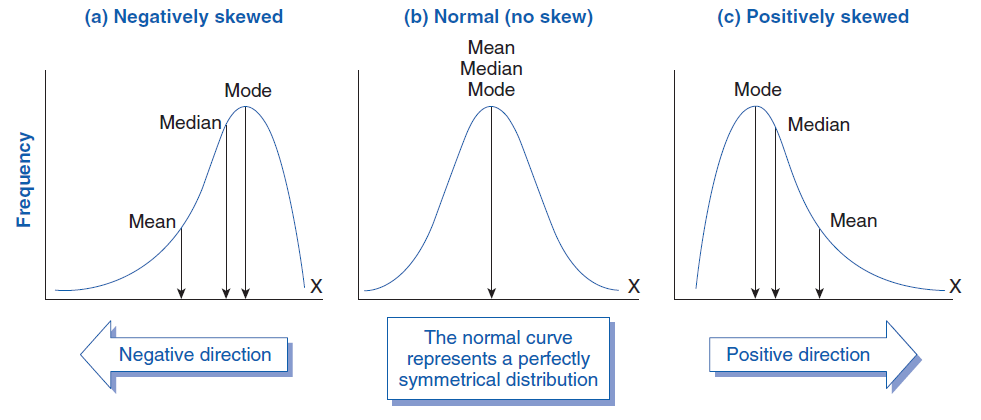
(Nguồn: https://www.biologyforlife.com/skew.html)
Qualitative Data
- Both a frequency distribution and a histogram can be constructed when the data set is qualitative (categorical) in nature; in this case, “bar graph” is synonymous with “histogram.”
- With such categorical data, the intervals above which rectangles are constructed should have equal width.
Nguồn của thông tin:
- Devore, J. L., Berk, K. N., & Carlton, M. A. (2012). Modern mathematical statistics with applications (Vol. 285). New York: Springer.


Không có nhận xét nào:
Đăng nhận xét