Both factor analysis method ( known as common factor analysis and component analysis) are interested in the best linear combination of variables - best in the sense that the particular combination of original variables accounts for more of the variance in the data as a whole than any other linear combination of variables.
Therefore,
- the first factor may be viewed as the single best summary of linear relationships exhibited in the data.
- The second factor is defined as the second-best linear combination of the variables, subject to the constraint that it is orthogonal to the first factor.
- To be orthogonal to the first factor, the second factor must be derived from the variance remaining after the first factor has been extracted.
- Thus, the second factor may be defined as the linear combination of variables that accounts for the most variance that is still unexplained after the effect of the first factor has been removed from the data.
- The process continues extracting factors accounting for smaller and smaller amounts of variance until all of the variance is explained.
How many factors to extract or retain?
- The researcher must combine a conceptual foundation (How many factors should be in the structure?) with some empirical evidence (How many factors can be reasonably supported?).
- An exact quantitative basis for deciding the number of factors to extract has not been developed. However, the following stopping criteria for the number of factors to extract are currently being utilized.
LATENT ROOT CRITERION
- This technique is simple to apply to either components analysis or common factor analysis.
- The rationale for the latent root criterion is that any individual factor should account for the variance of at least a single variable if it is to be retained for interpretation.
- With component analysis each variable contributes a value of 1 to the total eigenvalue.
- Thus, only the factors having latent roots or eigenvalues greater than 1 are considered significant; all factors with latent roots less than 1 are considered insignificant and are disregarded.
- Using the eigenvalue for establishing a cutoff is most reliable when the number of variables is between 20 and 50.
- If the number of variables is less than 20, the tendency is for this method to extract a conservative number of factors (too few);
- whereas if more than 50 variables are involved, it is not uncommon for too many factors to be extracted.
A PRIORI CRITERION
- The a priori criterion is that the researcher already knows how many factors to extract before undertaking the factor analysis.
- The researcher simply instructs the computer to stop the analysis when the desired number of factors has been extracted.
- This approach is useful when testing a theory or hypothesis about the number of factors to be extracted.
PERCENTAGE OF VARIANCE CRITERION
- The percentage of variance criterion is an approach based on achieving a specified cumulative percentage of total variance extracted by successive factors.
- The purpose is to ensure practical significance for the derived factors by ensuring that they explain at least a specified amount of variance. No absolute threshold has been adopted for all applications.
- However, in the natural sciences the factoring procedure usually should not be stopped until the extracted factors account for at least 95 percent of the variance or until the last factor accounts for only a small portion (less than 5%).
- In contrast, in the social sciences, where information is often less precise, it is not uncommon to consider a solution that accounts for 60 percent of the total variance (and in some instances even less) as satisfactory.
- A variant of this criterion involves selecting enough factors to achieve a prespecified communality for each of the variables.
- If theoretical or practical reasons require a certain communality for each variable, then the researcher will include as many factors as necessary to adequately represent each of the original variables.
- This approach differs from focusing on just the total amount of variance explained, which neglects the degree of explanation for the individual variables.
SCREE TEST CRITERION
- With the component analysis factor model the later factors extracted contain both common and unique variance.
- Although all factors contain at least some unique variance, the proportion of unique variance is substantially higher in later factors.
- The scree test is used to identify the optimum number of factors that can be extracted before the amount of unique variance begins to dominate the common variance structure
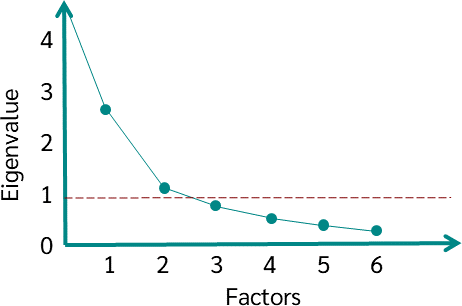
(Nguồn: https://datatab.net/assets/tutorial/PCA/en/Scree_test.png)
- The scree test is derived by plotting the latent roots against the number of factors in their order of extraction, and the shape of the resulting curve is used to evaluate the cutoff point.
HETEROGENEITY OF THE RESPONDENTS
- Shared variance among variables is the basis for both common and component factor models. An underlying assumption is that shared variance extends across the entire sample.
- If the sample is heterogeneous with regard to at least one subset of the variables, then the first factors will represent those variables that are more homogeneous across the entire sample. Variables that are better discriminators between the subgroups of the sample will load on later factors, many times those not selected by the criteria discussed previously.
- When the objective is to identify factors that discriminate among the subgroups of a sample, the researcher should extract additional factors beyond those indicated by the methods just discussed and examine the additional factors’ ability to discriminate among the groups. (Nghĩa là nếu mục tiêu là xác định nhân tố giúp phân biệt giữa các nhóm con trong một mẫu, thì bên cạnh các nhân tố đã được chọn ra theo các điều kiện bên trên, cần bổ sung thêm nhân tố giúp giải thích tốt sự khác biệt giữa các nhóm)
- If they prove less beneficial in discrimination, the solution can be run again and these later factors eliminated.

(Nguồn: Hair et al, 2013)
Nguồn thông tin:
- Hair, J. F., Black, W. C., Babin, B. J., & Anderson, R. E. (2013). Multivariate data analysis (8th ed.). Boston: Cengage.


Không có nhận xét nào:
Đăng nhận xét