Outliers are observations with a unique combination of characteristics identifiable as distinctly different from the other observations. It is judged to be an unusually high or low value on a variable or a unique combination of values across several variables that make the observation stand out from the others.
- From a practical standpoint, outliers can have a marked effect on any type of empirical analysis.
- In substantive terms, the outlier must be viewed in light of how representative it is of the population
- When beneficial, outliers—although different from the majority of the sample— may be indicative of characteristics of the population that would not be discovered in the normal course of analysis.
- In contrast, problematic outliers are not representative of the population, are counter to the objectives of the analysis, and can seriously distort statistical tests. Owing to the varying impact of outliers, it is imperative that the researcher examine the data for the presence of outliers and ascertain their type of influence. Additionally, outliers should be placed in a framework particularly suited for assessing the influence of individual observations and determining whether this influence is helpful or harmful.
- Univariate Detection.
The univariate identification of outliers examines the distribution of observations for each variable in the analysis and selects as outliers those cases falling at the outer ranges (high or low) of the distribution. The primary issue is establishing the threshold for designation of an outlier. The typical approach first converts the data values to standard scores, which have a mean of 0 and a standard deviation of 1. Because the values are expressed in a standardized format, comparisons across variables can be made easily.

In either case, the researcher must recognize that a certain number of observations may occur normally in these outer ranges of the distribution. The researcher should strive to identify only those truly distinctive observations and designate them as outliers.
- Bivariate Detection.
In addition to the univariate assessment, pairs of variables can be assessed jointly through a scatterplot. Cases that fall markedly outside the range of the other observations will be seen as isolated points in the scatterplot. To assist in determining the expected range of observations in this two-dimensional portrayal, an ellipse representing a bivariate normal distribution’s confidence interval (typically set at the 90% or 95% level) is superimposed over the scatterplot. This ellipse provides a graphical portrayal of the confidence limits and facilitates identification of the outliers. A variant of the scatterplot is termed the influence plot, with each point varying in size in relation to its influence on the relationship.
Each of these methods provides an assessment of the uniqueness of each observation in relationship to the other observation based on a specific pair of variables. A drawback of the bivariate method in general is the potentially large number of scatterplots that arise as the number of variables increases. For three variables, it is only three graphs for all pairwise comparisons. But for five variables, it takes 10 graphs, and for 10 variables it takes 45 scatterplots! As a result, the researcher should limit the general use of bivariate methods to specific relationships between variables, such as the relationship of the dependent versus independent variables in regression. The researcher can then examine the set of scatterplots and identify any general pattern of one or more observations that would result in their designation as outliers.
- Multivariate Detection.
Because most multivariate analyses involve more than two variables, the bivariate methods quickly become inadequate for several reasons. First, they require a large number of graphs, as discussed previously, when the number of variables reaches even moderate size. Second, they are limited to two dimensions (variables) at a time. Yet when more than two variables are considered, the researcher needs a means to objectively measure the multidimensional position of each observation relative to some common point.
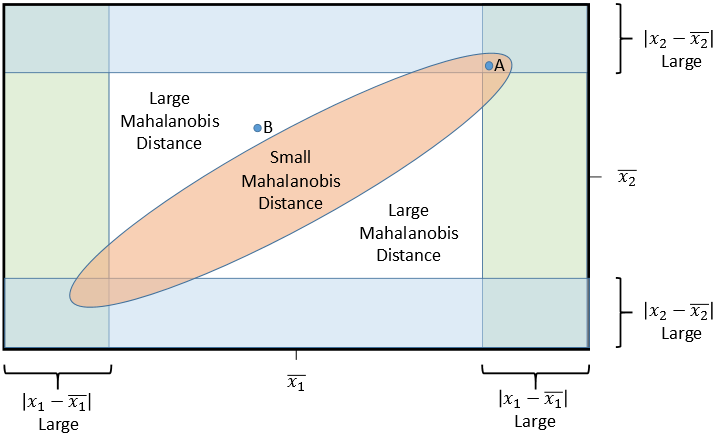
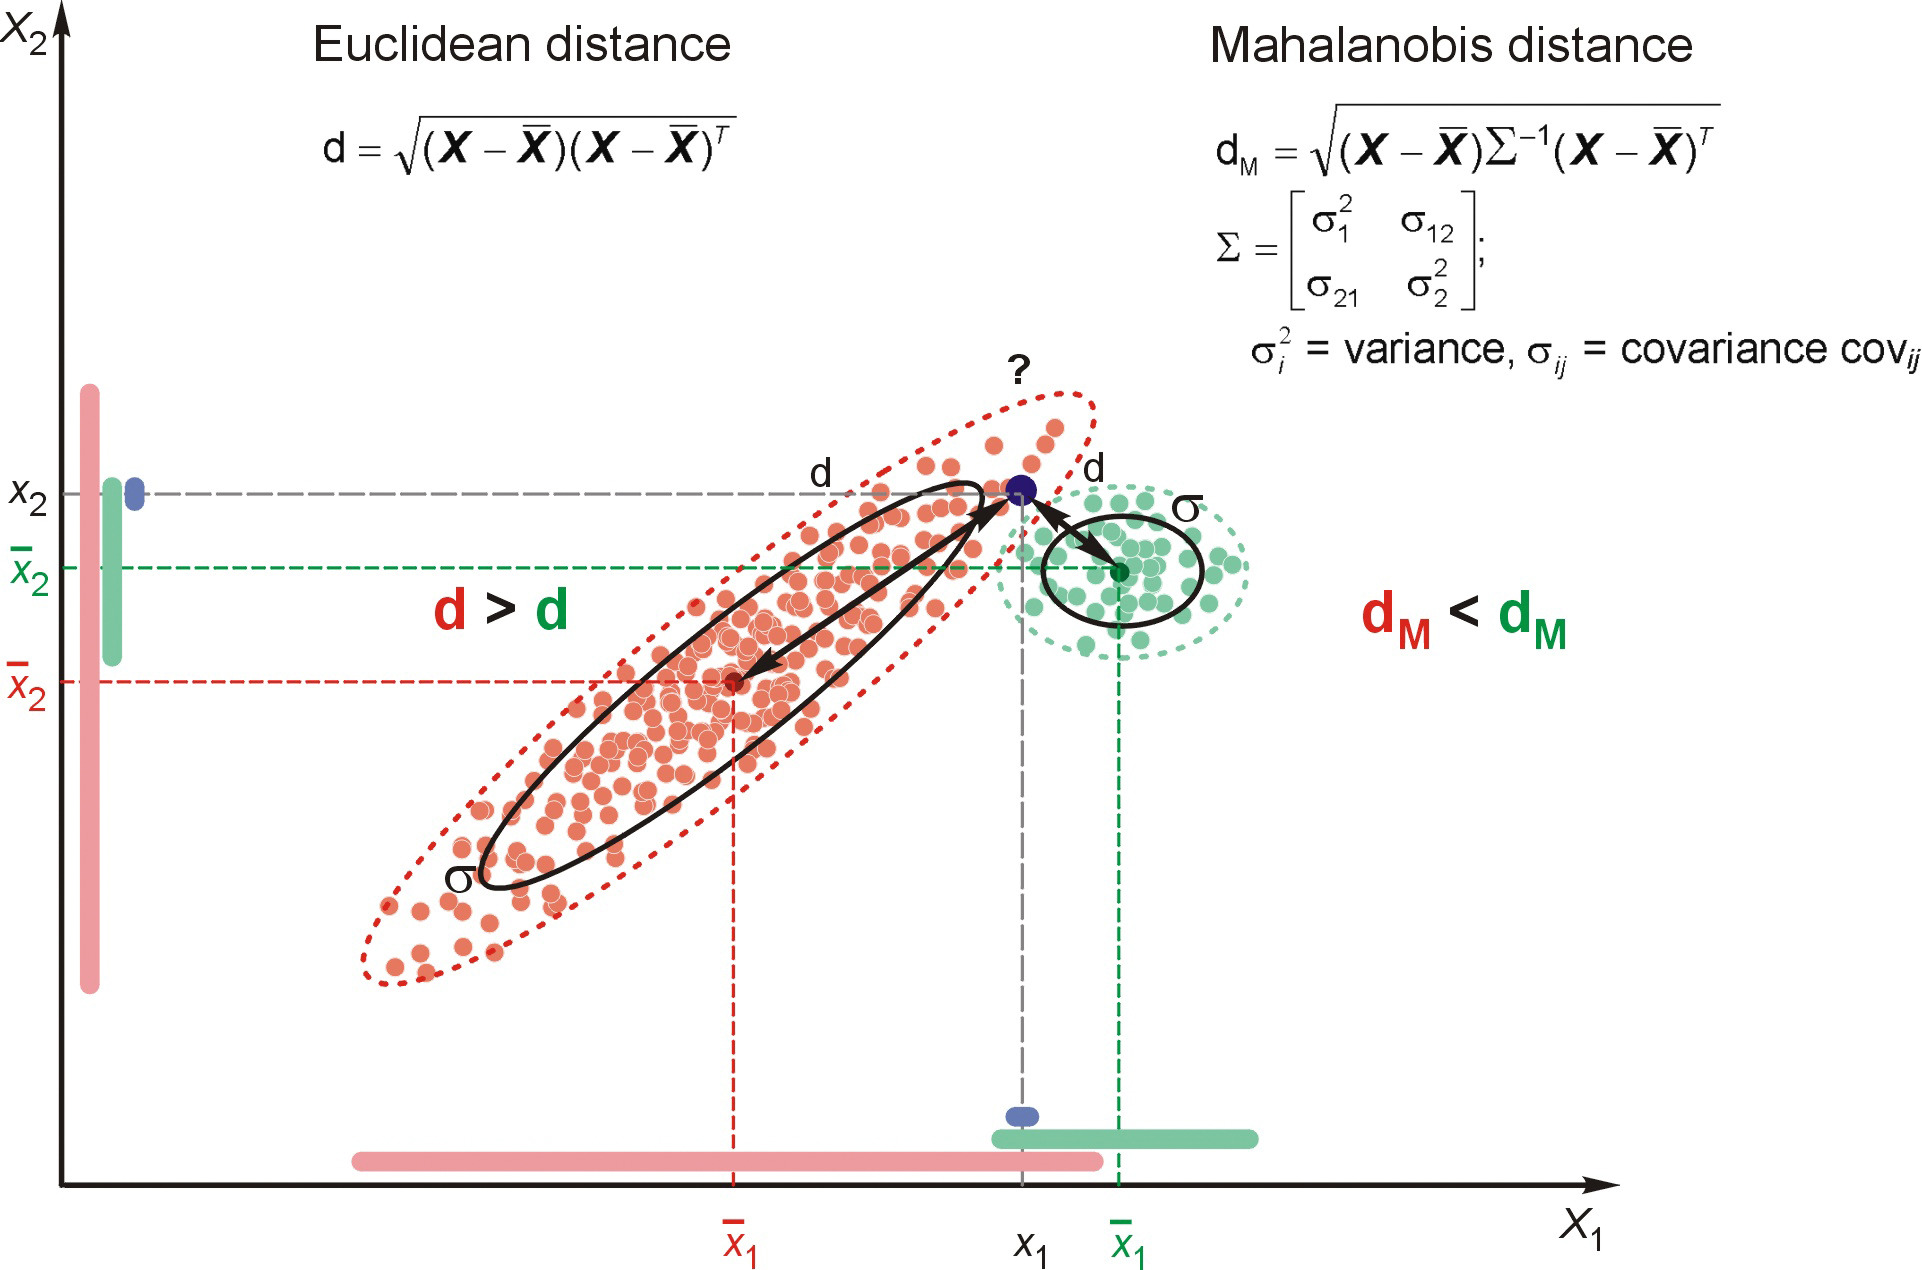
This issue is addressed by the Mahalanobis D2 measure, a multivariate assessment of each observation across a set of variables. This method measures each observation’s distance in multidimensional space from the mean center of all observations, providing a single value for each observation no matter how many variables are considered. Higher D2 values represent observations farther removed from the general distribution of observations in this multidimensional space. This method, however, also has the drawback of only providing an overall assessment, such that it provides no insight as to which particular variables might lead to a high D2 value.

RETENTION OR DELETION OF THE OUTLIER
After the outliers are identified, profiled, and categorized, the researcher must decide on the retention or deletion of each one. Many philosophies among researchers offer guidance as to how to deal with outliers. Our belief is that they should be retained unless demonstrable proof indicates that they are truly aberrant and not representative of any observations in the population. If they do portray a representative element or segment of the population, they should be retained to ensure generalizability to the entire population. As outliers are deleted, the researcher runs the risk of improving the multivariate analysis but limiting its generalizability. If outliers are problematic in a particular technique, many times they can be accommodated in the analysis in a manner in which they do not seriously distort the analysis.
Nguồn:
- Hair, J. F. (2009). Multivariate data analysis.


Không có nhận xét nào:
Đăng nhận xét