Thứ Ba, 30 tháng 4, 2024

Assessments

What are Assessments?

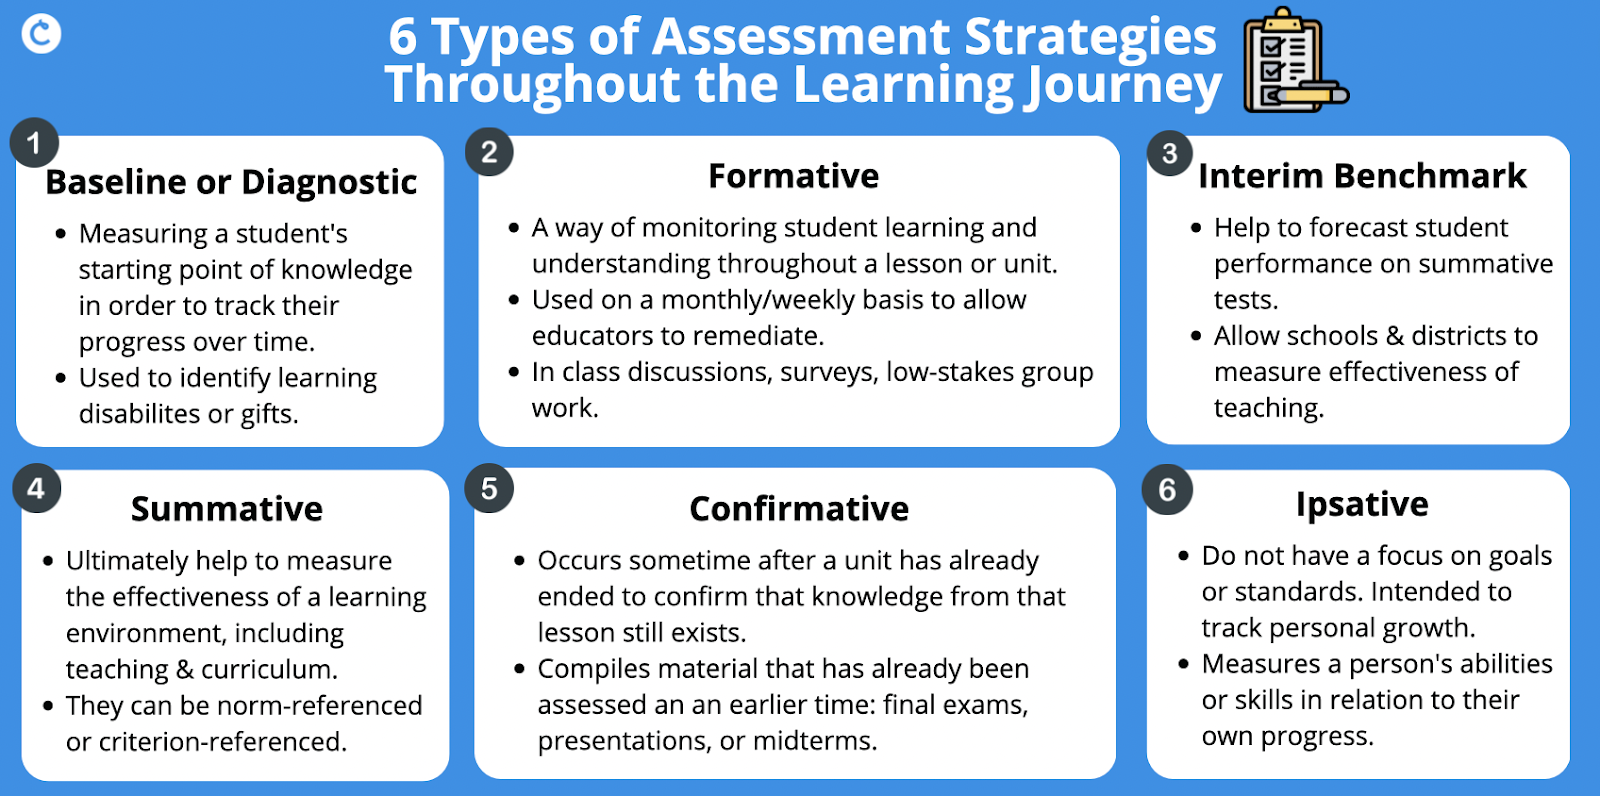
  • Assessments are often mistaken with standardized tests that determine grades and ranks. In reality, assessment is an umbrella term that incorporates standardized tests and many other forms of evaluation. It refers to a wide range of methods that educators use to assess learners at different levels of learning.


  • In other words, assessment refers to the systematic gathering of information that evaluates, measures, and documents the performance of learners to give a clear picture of their academic readiness, learning progress, and acquisition of skills. Moreover, assessments help identify the strengths and weaknesses of the students. This helps teachers modify their teaching techniques according to the students’ learning requirements.


  • Other than providing diagnostic feedback, assessments motivate students as well as teachers in different ways. Students get a chance to demonstrate their skills and improve through self-assessment, and teachers get directions to help the students perform better in learning through improved instructions.


(Nguồn: https://cte-blog.uwaterloo.ca/ipsative-assessment-an-engineering-experience/)


Types of Assessments

1. Diagnostic Assessment or Pre-Assessment

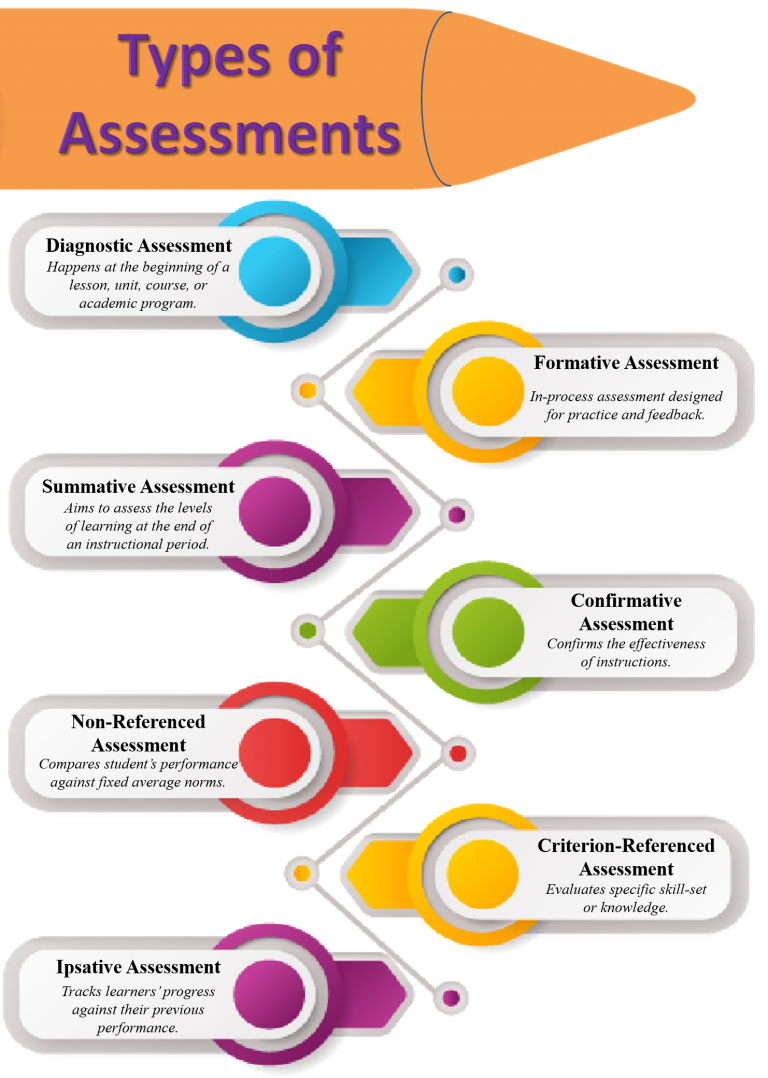
Diagnostic or pre-assessments happen before the beginning of a lesson, unit, course, or any academic program. They are useful for collecting information about the strengths, weaknesses, skills, and knowledge the learners possess. Instructions are designed thereafter as per the learners’ requirements.


2. Formative Assessment  

These are the in-process assessments that support learning. A teacher administers formative assessment multiple times during a unit, lesson, or course. They are particularly designed for practice. Additionally, the most important function of formative assessment is to monitor learning and provide feedback to modify instructions.

It acts as a form of continuous learning, covering small content areas while also monitoring the learning process. However, such types of evaluations do not assign ranks and grades. 


3. Summative Assessment

This type of assessment aims to assess the learning levels at the end of an instructional period. It attempts to measure the effectiveness of learning, the student’s proficiency, and their success. For this, this method uses tests, assignments, and projects for specific grading and ranking of students.

Moreover, it measures the knowledge, skills, and attitude of the learners in the long run. Hence, it gives an insight into the students’ performance as well as the effectiveness of a teacher’s instructions. 


4. Confirmative Assessment

As the name suggests, confirmative assessment is a way to confirm the effectiveness of instructions a year after the end of an instructional period. The ultimate goal here is to check whether the employed instructional strategies are still successful and that the teaching is accurate. Therefore, they are, most importantly, an extensive form of summative assessment.


5. Norm-Referenced Assessment

In this assessment, teachers compare a student’s performance against certain fixed average national norms. For instance, the average grade in English state-wise. 

Moreover, it compares the students’ performance with their peers in a competitive environment. Here, the average grade comparison is with the entire school. Hence, this assessment is also referred to as Group/Demographic Assessment.

6. Criterion-Referenced Assessment

Criterion-referenced tests evaluate specific skill-set or knowledge against pre-determined criteria of learning. It checks the learning requirements and abilities of the students at a particular learning stage. These tests evaluate the students on specific goals, objectives, or standards. In other words, it evaluates the entire course curriculum.


7. Ipsative Assessment

Ipsative assessment tests track the learners’ progress against their previous performance. The learners attempt to improve through comparison with previous results.


(Nguồn: https://www.evelynlearning.com/what-are-assessments/)


Nguồn tham khảo:

  • https://www.evelynlearning.com/what-are-assessments/
Chủ Nhật, 28 tháng 4, 2024

Ipsatizing

"Ipsative data" là gì?
  • Thuật ngữ "ipsative" được dùng đầu tiên bởi Cattell (1994) để gán nhãn cho một trong ba loại thang đo cơ bản trong tâm lý học.
  • "ipsative" có nguồn gốc từ tiếng  Latin (từ ipse có nghĩa là he, himself)
  • Ba loại thang đo cơ bản trong tâm lý học theo Cattell đó là:
    • interactive scale: giá trị một biến số của một cá nhân được ghi nhận độc lập với các cá nhân khác và độc lập với các biến số khác. Số liệu thô khi người dùng trả lời khảo sát là ví dụ của loại  dữ liệu này. 
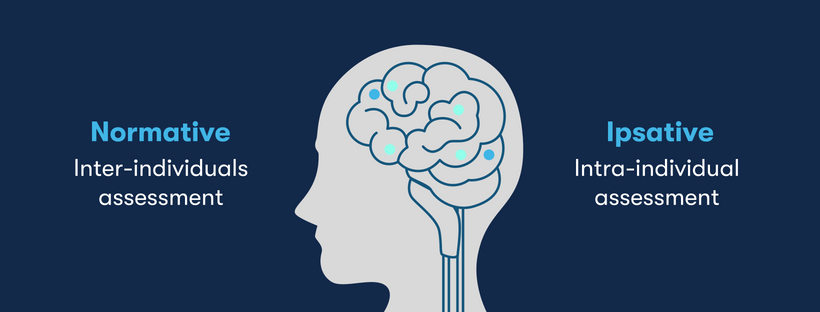
    • normative scale: giá trị một biến số của một cá nhân được đo lường bằng cách so sánh tương đối với các cá nhân khác ở cùng một biến số đó. Ví dụ như z-score khi chuẩn hóa (standardization)
    • ipsative scale:  giá trị một biến số của một cá nhân được đo lường bằng cách so sánh tương đối với giá trị của chính cá nhân đó ở các biến số khác; hoặc so sánh với giá trị chính cá nhân đó ở những thời điểm hoặc ngữ cảnh khác.

(Nguồn: https://www.skeeled.com/blog/pre-employment-assessments-normative-vs-ipsative)


"Ipsatizing data" là gì?

"Ipsatizing data" là quá trình chuyển đổi dữ liệu thông thường thành dữ liệu ipsative. Quá trình này đặc biệt hữu ích khi muốn phân tích sự thay đổi trong các biến của một cá nhân theo thời gian hoặc trong ngữ cảnh khác nhau.

Một số phương pháp để Ipsatizing data:
  • Cách 1: chia giá trị một biến cụ thể của một cá nhân cho tổng của tất cả các biến của cá nhân đó. Kết quả sẽ là phần trăm mà mỗi biến chiếm trong toàn bộ dữ liệu của cá nhân đó.
  • Cách 2: sử dụng điểm số tương đối, trong đó giá trị một biến của cá nhân này được so sánh với giá trị của chính cá nhân đó tại những thời điểm khác. Điều này giúp theo dõi sự thay đổi trong các biến của mỗi cá nhân theo thời gian.
  • Cách 3:  Một cách khác để ipsatize data là sử dụng xếp hạng, trong đó các giá trị tại nhiều thời điểm khác nhau của cùng một cá nhân được xếp hạng để so sánh giữa các thời điểm đó. Kết quả là mỗi giá trị được biểu diễn dưới dạng xếp hạng thứ bậc thay vì giá trị tuyệt đối ban đầu. 
  • Cách 4: Một phương pháp khác là sử dụng z-score cá nhân, trong đó mỗi giá trị của mỗi cá nhân được chuyển đổi thành một điểm số dựa trên khoảng cách của nó so với trung bình của cá nhân đó.
Ứng dụng của ipsative data


(Nguồn: https://www.classtime.com/en/assessment)


Nguồn tham khảo:
  • Chan, W. (2003). ANALYZING IPSATIVE DATA IN PSYCHOLOGICAL RESEARCH. Behaviormetrika, 30(1), 99–121. doi:10.2333/bhmk.30.99 
  • 10.2333/bhmk.30.99

Thứ Sáu, 26 tháng 4, 2024

Data transformations

 Mục đích của việc biến đổi dữ liệu: 

  • Để củng cố các tính chất thống kê (enhancing statistical properties);  
  • Để việc giải thích kết quả được thuận lợi hơn (ease of interpretation); 
  • Để phù hợp với những mối quan hệ cụ thể giữa các biến (representing specific relationship types); 
  • Để việc phân tích được đơn giản hơn (simplification).

Việc biến đổi dữ liệu có thể căn cứ về mặt lý thuyết (phù hợp bản chất của dữ liệu và các mối quan hệ kinh tế) hoặc về mặt thực nghiệm (dựa trên đặc điểm thực tiễn của dữ liệu hoặc các kiểm định thống kê).

(Nguồn: https://basicmedicalkey.com/transformations/)


Biến đổi dữ liệu để củng cố các tính chất thống kê 

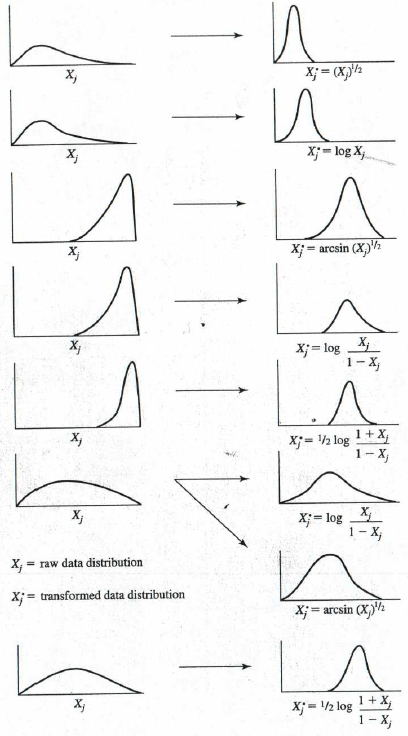
  • Để đạt được tính phân phối chuẩn của dữ liệu hoặc để thỏa mãn giả thiết về phương sai thuần nhất 
    • Đối với flat distribution, phép biến đổi thường dùng là lấy nghịch đảo ( the inverse : 1/or 1/X);
    • Đối với  positively skewed distributions phép biến đổi thường dùng là square root, logarithms;
    • Đối với  negatively skewed distributions phép biến đổi thường dùng là  squared, or cubed (X^2 hoặc  X^3) hoặc cũng có thể lấy nghịch đảo;
    • Đối với phương sai thay đổi, có thể kiểm tra  scatterplot để xem có dạng cone-shaped distribution hay không.  Nếu hình nón mở về bên phải (the cone opens to the right), thì lấy nghịch đảo; còn nếu hình nón mở về bên trái (the cone opens to the left), thì có thể lấy căn bậc 2.
    • Một số phép biến đổi phù hợp với một vài dạng dữ liệu cụ thể. Ví dụ
      • Dữ liệu dạng tần số bê dùng phép biến đổi lấy căn bậc hai (frequency counts suggest a square root transformation)
      • Dữ liệu dạng tỷ lệ thì phù hợp với phép biến đổi arcsin (proportions are best transformed by the arcsin transformation)
      • Biến đổi logarit phù hợp những trường hợp muốn biểu thị thay đổi dưới dạng phần trăm (proportional change is best handled by taking the logarithm of the variable).
Lưu ý là khi phép biến đổi dữ liệu được thực hiện, thì cũng cần kiểm tra lại là sau khi biến đổi, dữ liệu liệu đã đạt tính chất mong muốn.

(Nguồn: https://www.statisticssolutions.com/transforming-data-for-normality/)


  • Để đạt được tính tuyến tính của mô hình:
    • Một số dạng hàm phù hợp để biến đổi thành dạng tuyến tính được thể hiện dưới dạng hàm sau:
Nguồn: Hair(2009)


Biến đổi dữ liệu để việc giải thích kết quả được thuận lợ

  • Chuẩn hóa dữ liệu ( Standardization - tức là tính toán  z score hay standard score): Phép biến đổi này được thực hiện bằng cách lấy giá trị của biến trừ đi giá trị trung bình và chia cho độ lệch chuẩn. Kết quả là sau khi biến đổi, dữ liệu sẽ có giá trị trung bình bằng 0 và phương sai bằng 1.
  • Quy tâm dữ liệu (Centering): Phép biến đổi này được thực hiện bằng cách  lấy giá trị của các quan sát trừ cho giá trị cho giá trị trung bình của biến đó (nhưng không chia cho độ lệch chuẩn). Phép biến đổi này chỉ làm cho giá trị trung bình của biến trở thành 0 nhưng giữ nguyên phương sai của dữ liệu. Phép biến đổi quy tâm giúp cải tiến việc giải thích các hiệu ứng điều tiết và tương tác trong hồi quy bội, đặc biệt là giúp hiệu chỉnh cho hiện tượng đa cộng tuyến.

Biến đổi dữ liệu phù hợp với dạng dữ liệu

  • Log-linear: a log of the Y variable with an untransformed X variable provides an estimate of the percentage change in Y given a one unit change in X.
  • Linear-log: a log of the X variable with an untransformed Y variable provides an estimate of the unit change in Y for a percentage change in X
  • Log-log: a log of both X and Y provides the ratio of the percentage change of Y given a percentage change in X,
    the definition of elasticity.

Biến đổi dữ liệu để đạt được tính đơn giản trong mô hình

  • Binning: Phân loại các quan sát của một biến liên tục vào các "bins" (hay các nhóm dữ liệu). Phép biến đổi này sẽ chuyển đổi một biến định lượng thành một biến định tính.
  • Smoothing: Việc làm trơn dữ liệu cũng thường được áp dụng để dữ liệu được mượt hơn và giảm những biến động tức thời gây nhiễu kết quả.
Lưu ý:
  • Phải thật cẩn thận khi thực hiện biến đổi dữ liệu với những biến quan trọng

Nguồn tài liệu

  • Hair Jr., J.F., Black, W.C., Babin, B.J. and Anderson, R.E. (2009) Multivariate Data Analysis. 7th Edition, Prentice Hall
  • https://www.statisticssolutions.com/transforming-data-for-normality/ 
  • https://basicmedicalkey.com/transformations/
  • https://anatomisebiostats.com/biostatistics-blog/transforming-skewed-data/

Thứ Tư, 24 tháng 4, 2024

Bài NCKH ngắn nhất thế giới


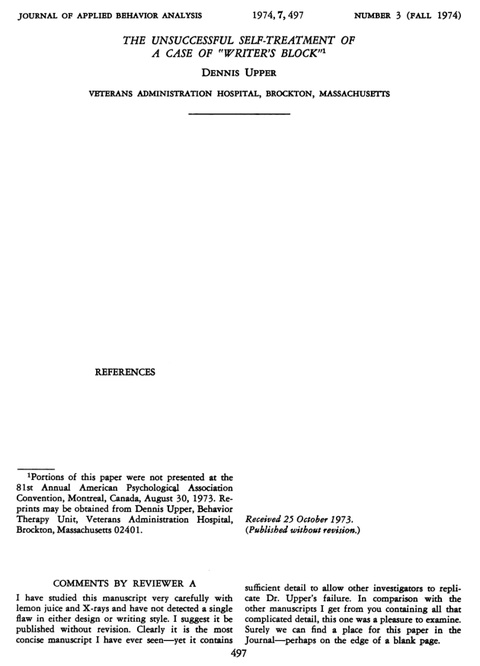
Bài báo này được xuất bản năm 1974 trên tạp chí Journal of Applied Behavioral Analysis với tiêu đề “The Unsuccessful Self-Treatment of a Case of ‘Writer's Block’” (Tạm dịch: "Tự điều trị không thành công trong một trường hợp bí ý tưởng”). Cả bài báo không có nổi một từ. Ngay cả danh mục tài liệu cũng không.


(Nguồn: https://paperpile.com/blog/shortest-papers/)


Một bài báo không có bất kỳ từ nào được viết (trừ phần abstract) cũng được đăng trên  tạp chí “Chemie in unserer Zeit” (50(2), 144–145) xuất bản bởi nhà xuất bản Wiley


(Nguồn: https://paperpile.com/blog/shortest-papers/)

Nguồn:
  • https://znews.vn/bai-bao-duoc-cong-bo-quoc-te-nhung-khong-co-noi-mot-tu-post1365071.html
  • https://paperpile.com/blog/shortest-papers/


Thứ Hai, 22 tháng 4, 2024

R-type versus Q-type factor analysis

Both types of factor analysis utilize a correlation matrix as the basic data input. 

  • With R-type factor analysis, the researcher would use a traditional correlation matrix (correlations among variables) as input.
  • But the researcher could also elect to derive the correlation matrix from the correlations between the individual respondents. In this Q-type factor analysis, the results would be a factor matrix that would identify similar individuals
  • From the results of a Q factor analysis, we could identify groups or clusters of individuals that demonstrate a similar pattern on the variables included in the analysis

A logical question at this point would be: How does Q-type factor analysis differ from cluster analysis, because both approaches compare the pattern of responses across a number of variables and place the respondents in groups? 

  • The answer is that Q-type factor analysis is based on the intercorrelations between the respondents, whereas cluster analysis forms groupings based on a distance-based similarity measure between the respondents’ scores on the variables being analyzed.
Nguồn:
  • Hair, J. F. (2009). Multivariate data analysis.

Thứ Bảy, 20 tháng 4, 2024

FACTOR ANALYSIS (Hair, 2013)

  • Factor analysis is an interdependence technique whose primary purpose is to define the underlying structure among the variables in the analysis. 
  • Broadly speaking, factor analysis provides the tools for analyzing the structure of the interrelationships (correlations) among a large number of variables (e.g., test scores, test items, questionnaire responses) by defining sets of variables that are highly interrelated, known as factors
  • Factor analytic techniques can achieve their purposes from either an exploratory or confirmatory perspective. 
FACTOR ANALYSIS DECISION PROCESS


(Nguồn: Hair, 2009)


(Nguồn: Hair, 2009)


Factor analysis provides the researcher with two distinct, but interrelated, outcomes: data summarization and data reduction
  • In summarizing the data, factor analysis derives underlying dimensions that, when interpreted and understood, describe the data in a much smaller number of concepts than the original individual variables. 
  • Data reduction extends this process by deriving an empirical value (factor score) for each dimension (factor) and then substituting this value for the original values.
DATA SUMMARIZATION
    • The fundamental concept involved in data summarization is the definition of structure. Through structure, the researcher can view the set of variables at various levels of generalization, ranging from the most detailed level (individual variables themselves) to the more generalized level, where individual variables are grouped and then viewed not for what they represent individually, but for what they represent collectively in expressing a concept.
    • The goal of data summarization is achieved by defining a small number of factors that adequately represent the original set of variables
    • Structure is defined by the interrelatedness among variables allowing for the specification of a smaller number of dimensions (factors) representing the original set of variables. 
      DATA REDUCTION
      • Factor analysis can also be used to achieve data reduction by 
        • (1) identifying representative variables from a much larger set of variables for use in subsequent multivariate analyses, 
        • or (2) creating an entirely new set of variables, much smaller in number, to partially or completely replace the original set of variables. 
      • In both instances, the purpose is to retain the nature and character of the original variables, but reduce their number to simplify the subsequent multivariate analysis. 
      Data summarization makes the identification of the underlying dimensions or factors ends in themselves. Thus, estimates of the factors and the contributions of each variable to the factors (termed loadings) are all that is required for the analysis. 

      Data reduction relies on the factor loadings as well, but uses them as the basis for either identifying variables for subsequent analysis with other techniques or making estimates of the factors themselves (factor scores or summated scales), which then replace the original variables in subsequent analyses. 

      Nguồn: 
      • Hair, J. F. (2009). Multivariate data analysis.

      Thứ Năm, 18 tháng 4, 2024

      Managing the Variate


      Specifying the Variate Variables

      • To decide whether to use the individual variables or to perform some form of dimensional reduction, such as exploratory factor analysis. 
      Variable Selection
      • To make regarding the variate is if the researcher wants to control the specific variables to be included in the analysis or let the software determine the “best” set of variables to constitute the variate.


      Nguồn: 
      • Hair, J. F., Black, W. C., Babin, B. J., & Anderson, R. E. (2019). Multivariate data analysis (8th ed.). Boston: Cengage.


      Ecological pyramids

      Tháp sinh thái (ecological pyramid) là biểu đồ mô tả tương quan giữa các bậc dinh dưỡng trong hệ sinh thái, được xếp chồng từ sinh vật sản ...