Thứ Bảy, 29 tháng 6, 2024

Output vs. Outcome


(Nguồn: https://mooncamp.com/images/resources/output-vs-outcome-infographic-b9c8482e.webp)


Output (Sản phẩm đầu ra):

  • Output hàm ý về sản phẩm, dịch vụ hoặc kết quả cụ thể từ các hoạt động.
  • Output dễ đo lường, xuất hiện ngay sau hoạt động, tập trung vào sản phẩm hoặc dịch vụ.
  • Ví dụ: Số lượng sách xuất bản, số lượng hội thảo tổ chức, số lượng máy tính phân phối.

(Nguồn: https://chisellabs.com/glossary/wp-content/uploads/2023/11/Output-vs-Outcome-Importance-and-Differences.png)


Outcomes (Kết quả):

  • Outcome hàm ý về những thay đổi hoặc tác động do các outputs và hoạt động của dự án gây ra.
  • Outcome khó đo lường hơn, xuất hiện sau một thời gian, tập trung vào thay đổi và tác động.
  • Ví dụ: Cải thiện kỹ năng học sinh, gia tăng mức độ hài lòng của nhân viên, giảm tỷ lệ mắc bệnh trong cộng đồng.
(Nguồn: https://chisellabs.com/glossary/wp-content/uploads/2023/11/Output-vs-Outcome-Importance-and-Differences-1.png)

Nguồn tham khảo

  • https://chisellabs.com/glossary/output-vs-outcome/
  • https://mooncamp.com/blog/output-vs-outcome/
  • https://www.bmc.com/blogs/outcomes-vs-outputs/


Thứ Năm, 27 tháng 6, 2024

Research ethics


(Nguồn: https://www.researchgate.net/profile/Nicholas-Steneck/publication)


Research ethics provides guidelines for the responsible conduct of research. In addition, it educates and monitors scientists conducting research to ensure a high ethical standard. The following is a general summary of some ethical principles:

Honesty (Trung thực):

Honestly report data, results, methods and procedures, and publication status. Do not fabricate, falsify, or misrepresent data.

Objectivity (Khách quan):

Strive to avoid bias in experimental design, data analysis, data interpretation, peer review, personnel decisions, grant writing, expert testimony, and other aspects of research.

Integrity (Chính trực):

Keep your promises and agreements; act with sincerity; strive for consistency of thought and action.

Carefulness (Cẩn trọng):

Avoid careless errors and negligence; carefully and critically examine your own work and the work of your peers. Keep good records of research activities.

Openness (Cởi mở):

Share data, results, ideas, tools, resources. Be open to criticism and new ideas.

Respect for Intellectual Property (Tôn trọng quyền sở hữu trí tuệ):

Honor patents, copyrights, and other forms of intellectual property. Do not use unpublished data, methods, or results without permission. Give credit where credit is due. Never plagiarize.

Confidentiality (Bảo mật):

Protect confidential communications, such as papers or grants submitted for publication, personnel records, trade or military secrets, and patient records.

Responsible Publication (Công bố có trách nhiệm):

Publish in order to advance research and scholarship, not to advance just your own career. Avoid wasteful and duplicative publication.

Responsible Mentoring (Hướng dẫn có trách nhiệm):

Help to educate, mentor, and advise students. Promote their welfare and allow them to make their own decisions.

Respect for Colleagues (Tôn trọng đồng nghiệp):

Respect your colleagues and treat them fairly.

Social Responsibility (Trách nhiệm xã hội):

Strive to promote social good and prevent or mitigate social harms through research, public education, and advocacy.

Non-Discrimination (Không phân biệt đối xử):

Avoid discrimination against colleagues or students on the basis of sex, race, ethnicity, or other factors that are not related to their scientific competence and integrity.

Competence (Năng lực):

Maintain and improve your own professional competence and expertise through lifelong education and learning; take steps to promote competence in science as a whole.

Legality (Tính hợp pháp):

Know and obey relevant laws and institutional and governmental policies.

Animal Care (Chăm sóc động vật):

Show proper respect and care for animals when using them in research. Do not conduct unnecessary or poorly designed animal experiments.

Human Subjects Protection (Bảo vệ con người):

When conducting research on human subjects, minimize harms and risks and maximize benefits; respect human dignity, privacy, and autonomy.


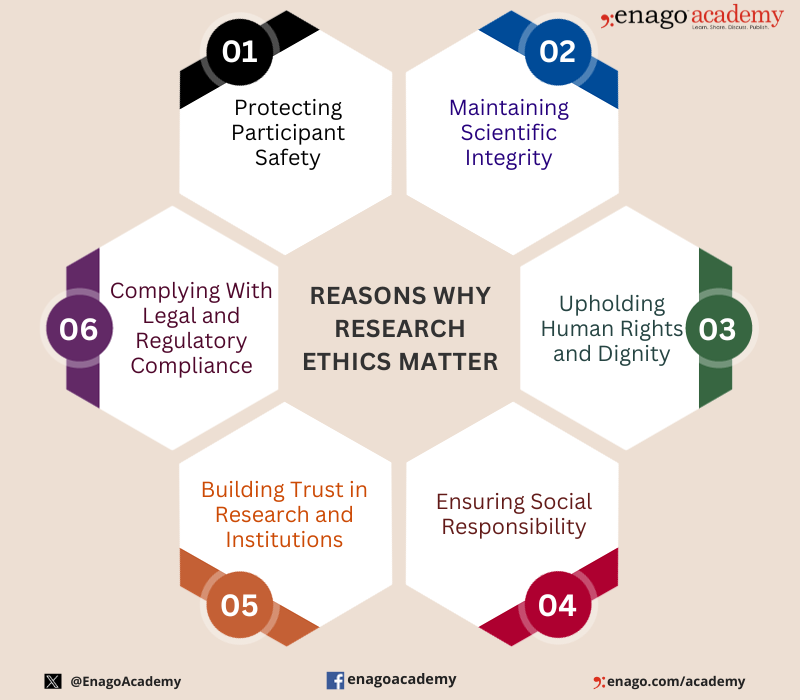
(Nguồn: https://www.enago.com/academy/wp-content/uploads/2023/12/WhyResearchEthicsMatter.png)


Nguồn tham khảo

  • https://libguides.library.cityu.edu.hk/researchmethods/ethics


Thứ Ba, 25 tháng 6, 2024

Integrity in Research


(Nguồn: https://ukrio.org/research-integrity/what-is-research-integrity/)


 Individual Level

For the individual scientist, integrity embodies above all a commitment to intellectual honesty and personal responsibility for one’s actions and to a range of

  • practices that characterize the responsible conduct of research, including
  • intellectual honesty in proposing, performing, and reporting research;
  • accuracy in representing contributions to research proposals and reports;
  • fairness in peer review;
  • collegiality in scientific interactions, including communications and sharin of resources;
  • transparency in conflicts of interest or potential conflicts of interest;
  • protection of human subjects in the conduct of research;
  • humane care of animals in the conduct of research; and
  • adherence to the mutual responsibilities between investigators and their research teams.

Institutional Level

Institutions seeking to create an environment that promotes responsible conduct by individual scientists and that fosters integrity must establish and continuously monitor structures, processes, policies, and procedures that

  • provide leadership in support of responsible conduct of research;
  • encourage respect for everyone involved in the research enterprise;
  • promote productive interactions between trainees and mentors;
  • advocate adherence to the rules regarding all aspects of the conduct of research, especially research involving human participants and animals;
  • anticipate, reveal, and manage individual and institutional conflicts of interest;
  • arrange timely and thorough inquiries and investigations of allegations of scientific misconduct and apply appropriate administrative sanctions;
  • offer educational opportunities pertaining to integrity in the conduct of research; and
  • monitor and evaluate the institutional environment supporting integrity in the conduct of research and use this knowledge for continuous quality improvement.
Nguồn tham khảo
  • National Research Council, Division on Earth, Life Studies, Board on Health Sciences Policy, & Committee on Assessing Integrity in Research Environments. (2002). Integrity in scientific research: Creating an environment that promotes responsible conduct.

Thứ Năm, 13 tháng 6, 2024

Forensic statistics

Thống kê pháp lý (forensic statistics) là một lĩnh vực khoa học ứng dụng các phương pháp thống kê để phân tích và đánh giá bằng chứng trong các quá trình điều tra và xét xử pháp lý. Với sự phát triển của công nghệ và yêu cầu ngày càng cao về độ chính xác và minh bạch trong hệ thống pháp lý, thống kê pháp lý đã trở thành một công cụ quan trọng, góp phần đảm bảo tính công bằng và chính xác trong việc xét xử các vụ án.


(Nguồn: https://www.taylorfrancis.com/)


Một số ví dụ của thống kê pháp lý như:

  • Phân tích chứng cứ DNA

Quá trình sử dụng thống kê trong phân tích chứng cứ DNA  bao gồm nhiều bước, từ thu thập mẫu DNA, phân tích mẫu, đến việc sử dụng các phương pháp thống kê để đánh giá khả năng mẫu DNA này thuộc về một cá nhân cụ thể. Một trong những chỉ số quan trọng được sử dụng là chỉ số phù hợp (match probability). Chỉ số này tính toán xác suất rằng mẫu DNA từ hiện trường khớp với DNA của một cá nhân ngẫu nhiên trong dân số. Xác suất này được tính dựa trên tần suất xuất hiện của các alen tại các loci trong dân số.

Ngoài chỉ số phù hợp, các chuyên gia thống kê còn sử dụng chỉ số tỷ lệ (Likelihood Ratio - LR) để đánh giá bằng chứng DNA. Chỉ số LR so sánh khả năng rằng mẫu DNA từ hiện trường thuộc về nghi phạm so với khả năng rằng mẫu DNA này thuộc về một cá nhân ngẫu nhiên.  Kết quả của phân tích thống kê sẽ cung cấp thông tin về mức độ tin cậy của sự khớp giữa mẫu DNA từ hiện trường và mẫu DNA của nghi phạm. Nếu chỉ số tỷ lệ LR cao, điều này có nghĩa rằng mẫu DNA từ hiện trường rất có khả năng thuộc về nghi phạm. Ngược lại, nếu chỉ số LR thấp, điều này có thể cho thấy rằng mẫu DNA từ hiện trường không thuộc về nghi phạm.

  • Phân tích dữ liệu tội phạm

Dữ liệu tội phạm có thể được thu thập từ nhiều nguồn khác nhau, bao gồm: Báo cáo tội phạm từ cơ quan cảnh sát; dữ liệu từ hệ thống tư pháp hình sự; khảo sát nạn nhân; dữ liệu từ camera an ninh và các thiết bị giám sát khác...Bằng cách dùng thống kê để hiểu rõ hơn về các mẫu và xu hướng tội phạm, cơ quan chức năng có thể phát triển các chiến lược phòng ngừa hiệu quả hơn, giúp giảm thiểu tội phạm và cải thiện an ninh cộng đồng. 

Các kỹ thuật thống kê  mô tả giúp tóm tắt và mô tả các đặc điểm cơ bản của dữ liệu tội phạm. Các kỹ thuật phổ biến bao gồm:

  • Tính toán các số liệu thống kê cơ bản như trung bình, trung vị, phương sai, độ lệch chuẩn
  • Vẽ biểu đồ tần suất, biểu đồ cột, biểu đồ đường để hiển thị phân bố của các loại tội phạm theo thời gian, địa điểm, và các yếu tố khác

Phân tích xu hướng giúp xác định các mẫu và xu hướng tội phạm theo thời gian. Ví dụ như:

  • Sử dụng chuỗi thời gian (time series) để theo dõi các thay đổi trong tội phạm qua các giai đoạn
  • Áp dụng các phương pháp như trung bình trượt (moving average) hoặc phân tích xu hướng (trend analysis) để làm mịn dữ liệu và xác định các xu hướng dài hạn trong vấn đề tội phạm

Phân tích không gian giúp xác định các khu vực có mức độ tội phạm cao và hiểu các yếu tố địa lý liên quan đến tội phạm. Các kỹ thuật bao gồm:

  • Sử dụng hệ thống thông tin địa lý (GIS) để vẽ bản đồ phân bố tội phạm
  • Áp dụng các phương pháp như phân tích điểm nóng (hotspot analysis) để xác định các khu vực có mức độ tội phạm cao
  • Phân tích tương quan không gian (spatial correlation) để hiểu mối quan hệ giữa tội phạm và các yếu tố môi trường

  • Đánh giá tính hợp lệ và độ tin cậy của các phương pháp thu thập và phân tích bằng chứng

Đánh giá tính hợp lệ và độ tin cậy của các phương pháp thu thập và phân tích bằng chứng bằng phương pháp thống kê là một quy trình quan trọng nhằm đảm bảo rằng các phương pháp này có thể cung cấp kết quả chính xác và đáng tin cậy. Điều này giúp đảm bảo tính công bằng và hiệu quả trong quá trình điều tra và xét xử pháp lý, đồng thời góp phần nâng cao chất lượng và độ tin cậy của hệ thống pháp lý.

Và còn rất nhiều các ví dụ khác về việc ứng dụng thống kê trong khoa học pháp lý.

Nguồn tham khảo:
  • https://forensicstats.org/blog/portfolio/the-role-of-statistics-in-forensic-science/
  • https://chance.amstat.org/2016/02/statisticians-and-forensic-science/

Thứ Ba, 11 tháng 6, 2024

Beta Coefficients

  • The variation in response scale and variability across variables makes direct interpretation problematic. 
  • Standardization converts variables to a common scale and variability, the most common being a mean of zero (0.0) and standard deviation of one (1.0). 
  • In this way, we make sure that all variables are comparable. 
  • The advantage is that they eliminate the problem of dealing with different units of measurement (as illustrated previously) and thus reflect the relative impact on the dependent variable of a change in one standard deviation in either variable. 
  • Now that we have a common unit of measurement, we can determine which variable has the most impact.

(Nguồn: https://www.dataanalytics.org.uk/beta-coefficients-from-linear-models/)


Although the beta coefficients represent an objective measure of importance that can be directly compared, two cautions must be observed in their use:
  • First, they should be used as a guide to the relative importance of individual independent variables only when collinearity is minimal. As we will see in the next section, collinearity can distort the contributions of any independent variable even if beta coefficients are used.
  • Second, the beta values can be interpreted only in the context of the other variables in the equation. For example, a beta value for family size reflects its importance only in relation to family income, not in any absolute sense. If another independent variable were added to the equation, the beta coefficient for family size would probably change, because some relationship between family size and the new independent variable is likely.
In summary, beta coefficients should be used only as a guide to the relative importance of the independent variables included in the equation and only for those variables with minimal multicollinearity.

Nguồn:

  • Hair, J. F., Black, W. C., Babin, B. J., & Anderson, R. E. (2013). Multivariate data analysis (8th ed.). Boston: Cengage.

    Chủ Nhật, 9 tháng 6, 2024

    MODERATOR EFFECTS

    What if an independent–dependent variable relationship is affected by another independent variable? 

    • This situation is termed a moderator effect, which occurs when the moderator variable, a second independent variable, changes the form of the relationship between another independent variable and the dependent variable. 
    • It is also known as an interaction effect and is similar to the interaction term found in analysis of variance and multivariate analysis of variance.
    (Nguồn: https://uedufy.com/how-to-perform-moderation-analysis-in-spss/)

    Adding the Moderator Effect

    • The moderator term is a compound variable formed by multiplying X1 by the moderator X2, 

    (Nguồn: Hair et al, 2013)

    • Because of the multicollinearity among the old and new variables, an approach similar to testing for the significance of polynomial (nonlinear) effects is employed. 
    • To determine whether the moderator effect is significant, the researcher follows a three-step process:
      1. Estimate the original (unmoderated) equation.
      2. Estimate the moderated relationship (original equation plus moderator variable)
      3. Assess the change in R2: If it is statistically significant, then a significant moderator effect is present. Only the incremental effect is assessed, not the significance of individual variables.

    Interpreting Moderator Effects.

    • The b3 coefficient, the moderator effect, indicates the unit change in the effect of X1 as X2 changes. The b1 and b2 coefficients now represent the effects of Xand X2, respectively, when the other independent variable is zero.
    • In the unmoderated relationship, the b1 coefficient represents the effect of X1 across all levels of X2, and similarly for b2. 
    • To determine the total effect of an independent variable, the separate and moderated effects must be combined.

    (Nguồn: https://link.springer.com/article/10.1007/s40815-020-00848-3)


    (Những nội dung này trích từ sách của Hair et al. (2013))

    Nguồn:

    • Hair, J. F., Black, W. C., Babin, B. J., & Anderson, R. E. (2013). Multivariate data analysis (8th ed.). Boston: Cengage.

    Thứ Sáu, 7 tháng 6, 2024

    CURVILINEAR EFFECTS

    •  Several types of data transformations are appropriate for linearizing a curvilinear relationship.
    • Direct approaches involve modifying the values through some arithmetic transformation (e.g., taking the square root or logarithm of the variable). However, such transformations are subject to the following limitations:
      • They are applicable only in a simple curvilinear relationship (a relationship with only one turning or inflection point).
      • They do not provide any statistical means for assessing whether the curvilinear or linear model is more appropriate.
      • They accommodate only univariate relationships and not the interaction between variables when more than one independent variable is involved.

    Specifying a Curvilinear Effect.


    (Nguồn: https://www.semanticscholar.org/paper/)


    • Power transformations of an independent variable that add a nonlinear component for each additional power of the independent variable are known as polynomials. 
      • The power of 1 (X1) represents the linear component.
      • The power of 2, the variable squared (X2), represents the quadratic component. In graphical terms, X2 represents the first inflection point of a curvilinear relationship. 
      • A cubic component, represented by the variable cubed (X3), adds a second inflection point. 
      • With these variables, and even higher powers, we can accommodate more complex relationships than are possible with only transformations.
    • Although any number of nonlinear components may be added, the cubic term is usually the highest power used. 
    • Multivariate polynomials are created when the regression equation contains two or more independent variables. We follow the same procedure for creating the polynomial terms as before, but must also create an additional term, the interaction term (X1X2), which is needed for each variable combination to represent fully the multivariate effects. 

    Interpreting a Curvilinear Effect

    • As each new variable is entered into the regression equation, we can also perform a direct statistical test of the nonlinear components, which we cannot do with data transformations.
    • However, multicollinearity can create problems in assessing the statistical significance of the individual coefficients to the extent that the researcher should assess incremental effects as a measure of any polynomial terms in a three-step process:
      1. Estimate the original regression equation.
      2. Estimate the curvilinear relationship (original equation plus polynomial term).
      3. Assess the change in R2. If it is statistically significant, then a significant curvilinear effect is present. The focus is on the incremental effect, not the significance of individual variables.
        For interpretation purposes, 
      • The positive quadratic term indicates a U -shaped curve, whereas a negative coefficient indicates a inverse U-shaped curve. 
      • The use of a cubic term can represent such forms as the S-shaped or growth curve quite easily, but it is generally best to plot the values to interpret the actual shape.
         How many terms should be added? 
      • Common practice is to start with the linear component and then sequentially add higher-order polynomials until nonsignificance is achieved. 

    Potential problems of using of polynomials

      • First, each additional term requires a degree of freedom, which may be particularly restrictive with small sample sizes.  This limitation does not occur with data transformations. 
      • Also, multicollinearity is introduced by the additional terms and makes statistical significance testing of the polynomial terms inappropriate. Instead, the researcher must compare the R2 values from the equation model with linear terms to the R2 for the equation with the polynomial terms.

    Nguồn:

    • Hair, J. F., Black, W. C., Babin, B. J., & Anderson, R. E. (2013). Multivariate data analysis (8th ed.). Boston: Cengage.

    Thứ Tư, 5 tháng 6, 2024

    Types of validity


    (Nguồn: https://www.chegg.com/writing/guides/research/types-of-validity-in-research/)


    • The validity of the research has two main types: 
      • inference validity (study-level)

      • and construct validity ( variable-level)
    • The inference validity that accounts for the whole research has two types: 
      • external validity 
    The external validity is all about the generalizability of the results. It tells to what extent the ‘ ‘study’s results can be generalized. It focuses on the applicability of the results and findings to the real world.
      • and internal validity.
    Internal validity checks the consistency of the conclusions claimed, especially those related to causality (cause and effect) with the results and design of the research. It tells how well a study is conducted. The internal validity of any research has three conditions:

    • The independent and dependent variables in the study should change together. 

    • The independent variable should precede the dependent variable in the study. 

    • Any other extraneous factors should not explain the result of the study.

    • Construct validity : refers to the validity of the measured variables in the research. It provides the surety about the measuring tools, whether they actually measure the things we are interested in. The construct validity is divided into two sub-types:
      • translation validity : refers to a subjective evaluation that examines whether the selected measures of the study are similar or different to the subject of the overall desired aim of the study. It is further divided into two types: 
        • face validity: Face validity accounts for the defining of a research project as good or bad based on subjective judgments (meaning it relies on people’s perceptions).
        • and content validity: Content validity checks whether the measured aspect used in research accurately represents the subject a researcher wants to measure. It is also based on subjective judgments.
      • and criterion validity: Criterion validity checks the relation of the measure used in the research to other characteristics and measures. It is divided into four sub-categories: predictive validity, concurrent validity, convergent validity, and discriminant validity.
        • predictive validity:  Predictive validity assesses the ability of the measure variables to predict future events and abilities. In this evaluation, the results obtained by testing a group subjected to a certain construct are compared with the future results.
        • concurrent validity: Concurrent validity evaluates the ability to distinguish between different groups. It provides the correlation between the test conducted in the research with other previously conducted research.
        • convergent validity: Convergent validity determines whether the constructs that are supposed to be related are related.
        • and descriptive validity: Discriminant validity checks that the constructs that are not supposed to be related are not related.


    (Nguồn: https://www.chegg.com/writing/guides/research/types-of-validity-in-research/)


    (Nguồn: https://revisesociology.com/ezoimgfmt/)


    Nguồn:
    • https://www.chegg.com/writing/guides/research/types-of-validity-in-research/
    • https://revisesociology.com/2018/01/04/validity-sociology-psychology-definition/


    Thứ Hai, 3 tháng 6, 2024

    NONMETRIC DATA


    (nguồn: https://kplex-project.com/wp-content/uploads/2017/04/scales.png)


    • One common situation faced by researchers is the desire to utilize nonmetric independent variables
    • When the dependent variable is measured as a dichotomous (0, 1) variable, either discriminant analysis or a specialized form of regression (logistic regression) is appropriate. 
    • What can we do when the independent variables are nonmetric and have two or more categories? 
    (Nguồn: https://2.bp.blogspot.com/)


    Indicator Coding: The Most Common Format. 

    • Of the two forms of dummy variable coding, the most common is indicator coding in which each category of the nonmetric variable is represented by either 1 or 0. 
    • The regression coefficients for the dummy variables represent differences on the dependent variable for each group of respondents from the reference category. 
    • These group differences can be assessed directly, because the coefficients are in the same units as the dependent variable.
    • This form of coding is most appropriate when a logical reference group is present, such as in an experiment. 

    Effects Coding

    • An alternative method of dummy-variable coding is termed effects coding.
    • It is the same as indicator coding except that the reference group is now given the value of -1 instead of 0 for the dummy variables. 
    • Now the coefficients represent differences for any group from the mean of all groups rather than from the reference group.
    • Both forms of dummy-variable coding will give the same predictive results, coefficient of determination, and regression coefficients for the continuous variables. The only differences will be in the interpretation of the dummy-variable coefficients.

    (Nguồn: https://www.researchgate.net/)


    Nguồn:

    • Hair, J. F., Black, W. C., Babin, B. J., & Anderson, R. E. (2013). Multivariate data analysis (8th ed.). Boston: Cengage.
    • https://kplex-project.com/2017/04/05/data-scales-in-applied-statistics-are-nominal-data-poor-in-information/
    • https://isme.edu.in/start-from-the-scratch-step-by-step-guidelines-for-quantitative-data-analysis-in-social-science-research/

    Thứ Bảy, 1 tháng 6, 2024

    Sample Size

     The sample size used in multiple regression is perhaps the single most influential element under the control of the researcher in designing the analysis. The effects of sample size are seen most directly in the statistical power of the significance testing and the generalizability of the result. Both issues are addressed in the following sections

    (Nguồn: https://real-statistics.com/wp-content/uploads/2012/11/statistical-power-chart.png)


    STATISTICAL POWER AND SAMPLE SIZE

    • The size of the sample has a direct impact on the appropriateness and the statistical power of multiple regression. 
    • Small samples, usually characterized as having fewer than 30 observations (?), are appropriate for analysis only by simple regression with a single independent variable. Even in these situations, only strong relationships can be detected with any degree of certainty. Likewise, large samples of 1,000 observations or more make the statistical significance tests overly sensitive, often indicating that almost any relationship is statistically significant. With such large samples the researcher must ensure that the criterion of practical significance is met along with statistical significance.
    • The researcher can also consider the role of sample size in significance testing before collecting data. If weaker relationships are expected, the researcher can make informed judgments as to the necessary sample size to reasonably detect the relationships, if they exist.

    GENERALIZABILITY AND SAMPLE SIZE

    • In addition to its role in determining statistical power, sample size also affects the generalizability of the results by the ratio of observations to independent variables.
    • A general rule is that the ratio should never fall below 5:1, meaning that five observations are made for each independent variable in the variate (Why?). Although the minimum ratio is 5:1, the desired level is between 15 to 20 observations for each indepenent variable. When this level is reached, the results should be generalizable if the sample is representative. However, if a stepwise procedure is employed, the recommended level increases to 50:1 because this technique selects only the strongest relationships within the data set and suffers from a greater tendency to become sample-specific. In cases for which the available sample does not meet these criteria, the researcher should be certain to validate the generalizability of the results.
    • As this ratio falls below 5:1, the researcher encounters the risk of overfitting the variate to the sample, making the results too specific to the sample and thus lacking generalizability. 

    Degrees of Freedom as a Measure of Generalizability.

    • We can perfectly predict one observation with a single variable, but what about all the other observations? Thus, the researcher is searching for the best regression model, one with the highest predictive accuracy for the largest (most generalizable) sample. The degree of generalizability is represented by the degrees of freedom, calculated as:
    Degrees of freedom (df) = Sample size - Number of estimated parameters
    • The larger the degrees of freedom, the more generalizable are the results. Degrees of freedom increase for a given sample by reducing the number of independent variables. Thus, the objective is to achieve the highest predictive accuracy with the most degrees of freedom. 
    • No specific guidelines determine how large the degrees of freedom are, just that they are indicative of the generalizability of the results and give an idea of the overfitting for any regression model

    Tài liệu gốc:

    • Hair, J. F., Black, W. C., Babin, B. J., & Anderson, R. E. (2013). Multivariate data analysis (8th ed.). Boston: Cengage.

    Fraud Triangle

     Tam giác gian lận, tiếng Anh là fraud triangle , là một mô hình lý thuyết được sử dụng để giải thích hành vi gian lận trong các tổ chức. Mô...